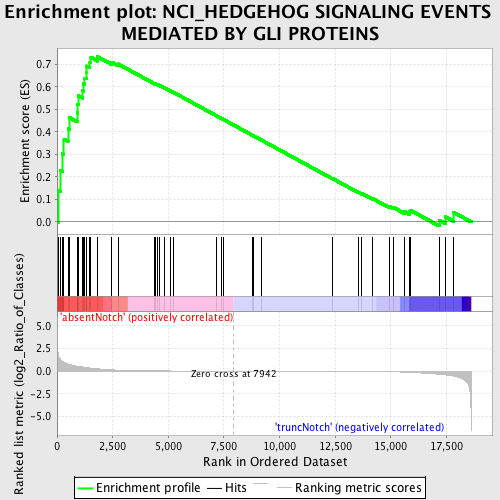
Profile of the Running ES Score & Positions of GeneSet Members on the Rank Ordered List
| Dataset | Set_03_absentNotch_versus_truncNotch.phenotype_absentNotch_versus_truncNotch.cls #absentNotch_versus_truncNotch.phenotype_absentNotch_versus_truncNotch.cls #absentNotch_versus_truncNotch_repos |
| Phenotype | phenotype_absentNotch_versus_truncNotch.cls#absentNotch_versus_truncNotch_repos |
| Upregulated in class | absentNotch |
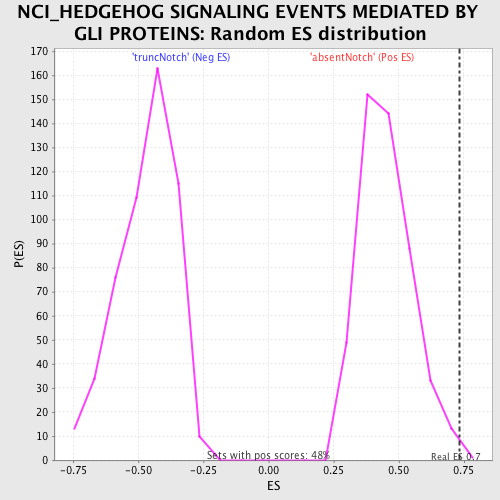
| GeneSet | NCI_HEDGEHOG SIGNALING EVENTS MEDIATED BY GLI PROTEINS |
| Enrichment Score (ES) | 0.73256916 |
| Normalized Enrichment Score (NES) | 1.6208999 |
| Nominal p-value | 0.00625 |
| FDR q-value | 0.17150983 |
| FWER p-Value | 0.488 |
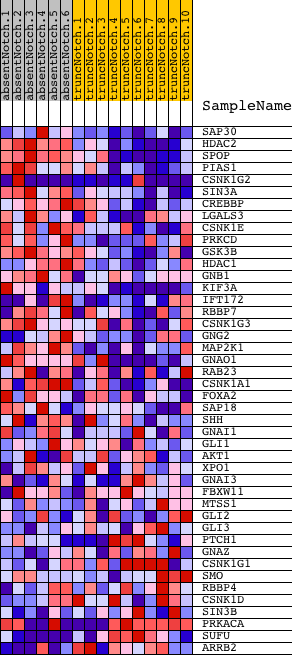
| PROBE | DESCRIPTION (from dataset) | GENE SYMBOL | GENE_TITLE | RANK IN GENE LIST | RANK METRIC SCORE | RUNNING ES | CORE ENRICHMENT | |
|---|---|---|---|---|---|---|---|---|
| 1 | SAP30 | 5080735 | 49 | 1.947 | 0.1406 | Yes | ||
| 2 | HDAC2 | 4050433 | 153 | 1.273 | 0.2287 | Yes | ||
| 3 | SPOP | 450035 | 232 | 1.060 | 0.3025 | Yes | ||
| 4 | PIAS1 | 5340301 | 308 | 0.946 | 0.3681 | Yes | ||
| 5 | CSNK1G2 | 3060095 4730037 | 492 | 0.763 | 0.4145 | Yes | ||
| 6 | SIN3A | 2190121 | 569 | 0.708 | 0.4625 | Yes | ||
| 7 | CREBBP | 5690035 7040050 | 909 | 0.541 | 0.4840 | Yes | ||
| 8 | LGALS3 | 2120239 | 920 | 0.538 | 0.5230 | Yes | ||
| 9 | CSNK1E | 2850347 5050093 6110301 | 951 | 0.518 | 0.5595 | Yes | ||
| 10 | PRKCD | 770592 | 1137 | 0.447 | 0.5825 | Yes | ||
| 11 | GSK3B | 5360348 | 1172 | 0.435 | 0.6127 | Yes | ||
| 12 | HDAC1 | 2850670 | 1248 | 0.409 | 0.6387 | Yes | ||
| 13 | GNB1 | 2120397 | 1309 | 0.386 | 0.6639 | Yes | ||
| 14 | KIF3A | 5050348 6650079 | 1313 | 0.385 | 0.6920 | Yes | ||
| 15 | IFT172 | 3800372 7100400 | 1474 | 0.342 | 0.7086 | Yes | ||
| 16 | RBBP7 | 430113 450450 2370309 | 1520 | 0.331 | 0.7305 | Yes | ||
| 17 | CSNK1G3 | 110450 | 1826 | 0.251 | 0.7326 | Yes | ||
| 18 | GNG2 | 2230390 | 2449 | 0.135 | 0.7090 | No | ||
| 19 | MAP2K1 | 840739 | 2740 | 0.103 | 0.7010 | No | ||
| 20 | GNAO1 | 2510292 6590487 | 4398 | 0.019 | 0.6132 | No | ||
| 21 | RAB23 | 2970075 | 4423 | 0.019 | 0.6133 | No | ||
| 22 | CSNK1A1 | 2340427 | 4528 | 0.017 | 0.6089 | No | ||
| 23 | FOXA2 | 540338 5860441 | 4599 | 0.016 | 0.6063 | No | ||
| 24 | SAP18 | 3610092 | 4815 | 0.014 | 0.5958 | No | ||
| 25 | SHH | 5570400 | 5085 | 0.011 | 0.5821 | No | ||
| 26 | GNAI1 | 4560390 | 5244 | 0.010 | 0.5743 | No | ||
| 27 | GLI1 | 4560176 | 7168 | 0.002 | 0.4709 | No | ||
| 28 | AKT1 | 5290746 | 7384 | 0.001 | 0.4594 | No | ||
| 29 | XPO1 | 540707 | 7497 | 0.001 | 0.4535 | No | ||
| 30 | GNAI3 | 4670739 | 8798 | -0.002 | 0.3837 | No | ||
| 31 | FBXW11 | 6450632 | 8833 | -0.002 | 0.3820 | No | ||
| 32 | MTSS1 | 780435 2370114 | 9195 | -0.003 | 0.3628 | No | ||
| 33 | GLI2 | 3060632 | 12387 | -0.017 | 0.1922 | No | ||
| 34 | GLI3 | 5690148 | 13552 | -0.031 | 0.1318 | No | ||
| 35 | PTCH1 | 430278 | 13702 | -0.034 | 0.1263 | No | ||
| 36 | GNAZ | 6130296 | 14178 | -0.044 | 0.1039 | No | ||
| 37 | CSNK1G1 | 840082 1230575 3940647 | 14956 | -0.069 | 0.0672 | No | ||
| 38 | SMO | 5340538 6350132 | 15133 | -0.079 | 0.0635 | No | ||
| 39 | RBBP4 | 6650528 | 15602 | -0.113 | 0.0466 | No | ||
| 40 | CSNK1D | 4280280 4480167 6450600 | 15821 | -0.134 | 0.0448 | No | ||
| 41 | SIN3B | 6650253 | 15863 | -0.139 | 0.0528 | No | ||
| 42 | PRKACA | 2640731 4050048 | 17174 | -0.342 | 0.0075 | No | ||
| 43 | SUFU | 6650181 | 17447 | -0.409 | 0.0229 | No | ||
| 44 | ARRB2 | 2060441 | 17813 | -0.543 | 0.0432 | No |